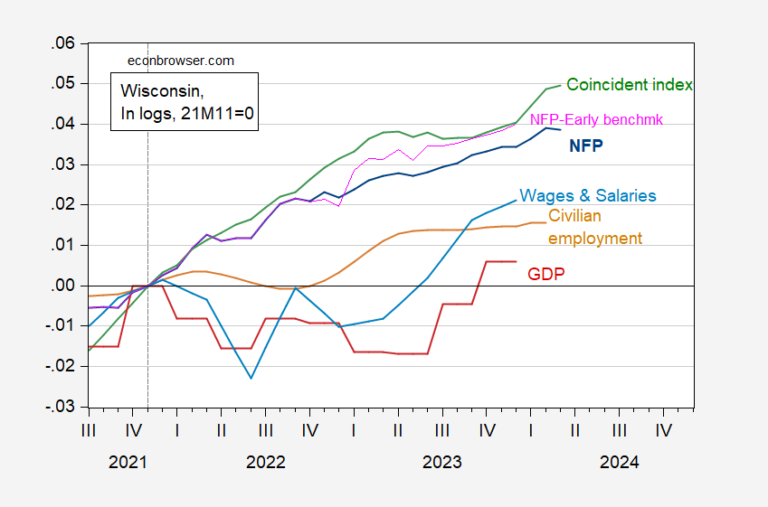
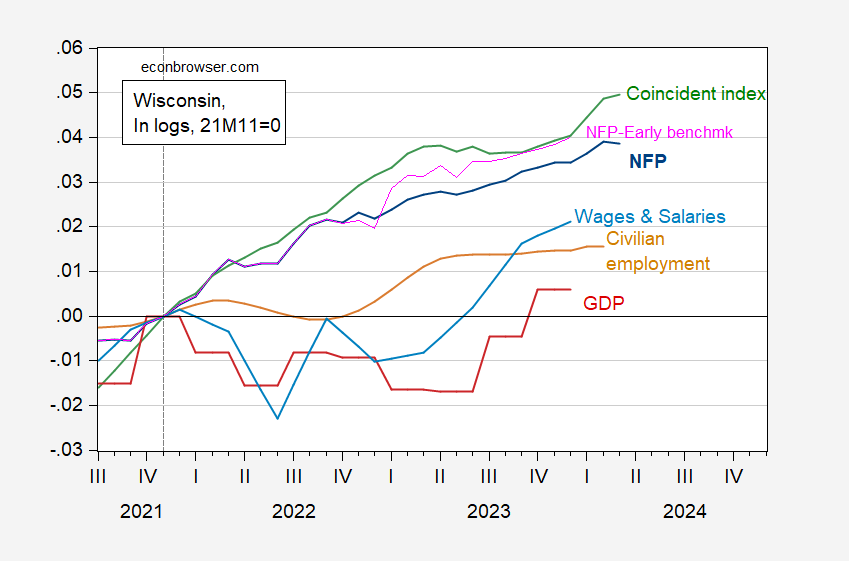
Continues to rise, according to the just-released Philadelphia Fed Coincident Index. The divergence with GDP persists.
Figure 1: Wisconsin nonfarm payroll employment (dark blue), Philadelphia Fed’s first NFP benchmark measure (pink), civilian employment (beige), linearly interpolated real wages and salaries, deflated by national chain CPI (sky blue ), GDP (red), coincident index (green), everything in the logs 2021M11=0. Source: BLS, BEA, Philadelphia Fed (1), (2)and the author’s calculations.
The 3-month annualized growth rate of the Wisconsin Coincident Index is 3.7%; y/y is 1.2%.
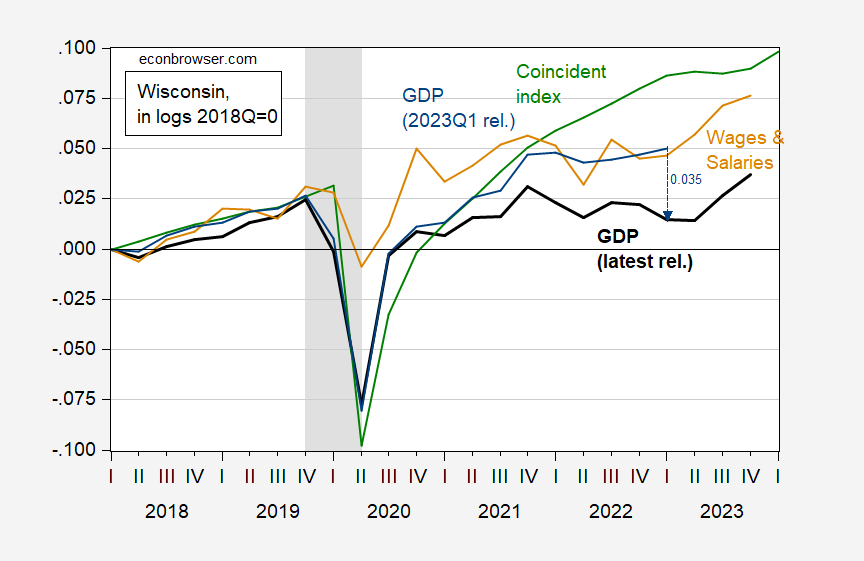
Note that there is a stark contrast between the GDP series and the other series. The GDP series is calculated based on the income definition of GDP and then using sectoral value added data at the national level to calculate equivalent GDP. In fact, GDP in the first quarter of 2023 was much higher, compared to the first quarter of 2018, than the corresponding revised baseline data for the corresponding quarter. See the figure below:
Figure 2: GDP in $Ch.2017 (bold black), GDP in $Ch.2012 from the publication of the first quarter of 2023 (blue), coincident index (green) and real wages and salaries (tan), all in logs, 2018Q1 =0. Wages and salaries deflated by the national chained CPI adjusted by the author using X-13. The NBER has defined the peak to trough dates of the national recession in gray. BEA, BLS, Philadelphia Fed, NBER and author’s calculations.
What causes the discrepancy between the most recent estimates of Wisconsin’s GDP and other indicators? I suspect this is partly related to the gap between GNI and GDP. At the national level, the gap is around 2% (in logarithmic terms).
Update, 1:41 Pacific:
I have one opinion article in the Milwaukee Journal Sentinel Today. I didn’t choose the title. I would have titled it “Wisconsinians Are More “Meh” Than You Would Expect Given Economic Conditions.”


