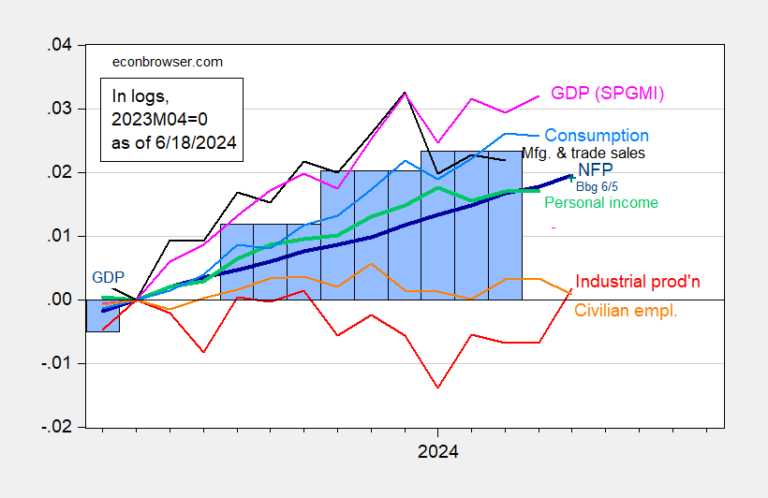
Industrial production surprises on the rise (0.9% against 0.3% m/m), while nominal retail sales increase modestly (0.1 real against 0.3% consensus).
Figure 1: CES non-agricultural employment (NFP) (bold blue), civilian employment (orange), industrial production (red), personal income excluding current transfers in Ch.2017 $ (bold green), manufacturing and commercial sales in Ch.2017 $ ( black), consumption in $Ch.2017 (light blue) and monthly GDP in $Ch.2017 (pink), GDP (blue bars), all logarithmic normalized to 2021M11=0. Source: BLS via FRED, Federal Reserve, second version of BEA 2024Q1, S&P Global Market Overview (née Macroeconomic Advisors, IHS Markit) (6/1/version 2024) and calculations by the author.
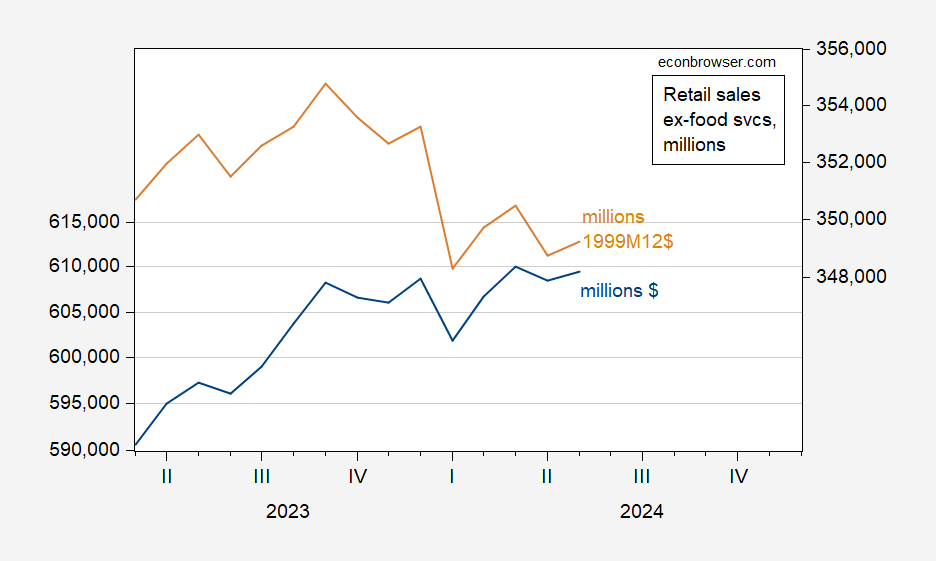
Retail sales:
Figure 2: Retail sales, in millions of dollars/month (blue, left scale) and in millions of dollars 1999M12/month (beige, right scale). Deflated using the seasonally adjusted chained CPI by the author using X-13. Source: Census, BLS, author’s calculations.
Core retail sales are down 0.1% versus a consensus of +0.2%.
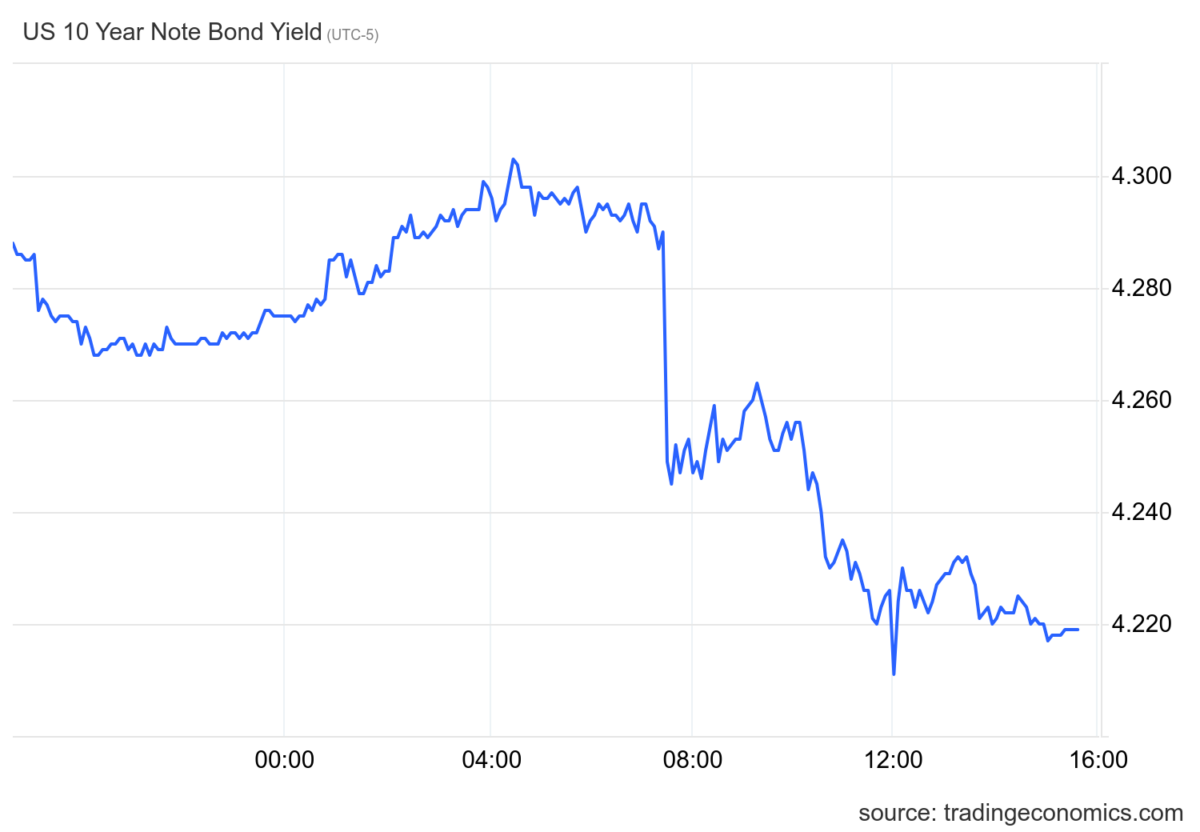
Treasury yields fell significantly, driven by weaker-than-expected retail sales figures.


