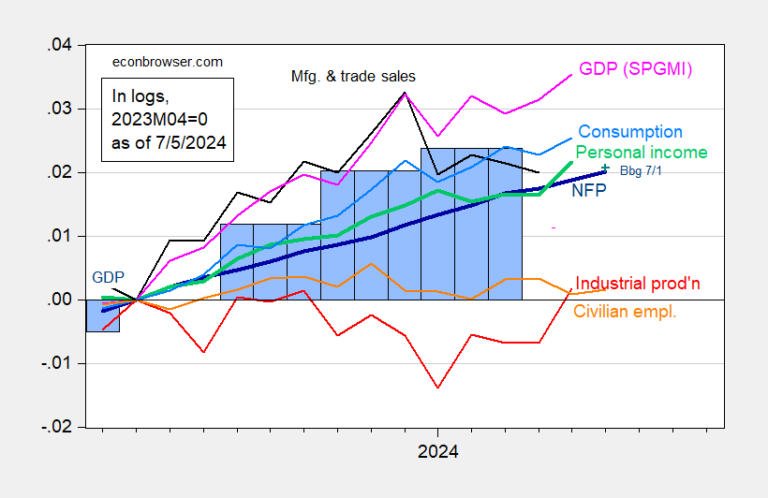
NFP at +206K against +191K.
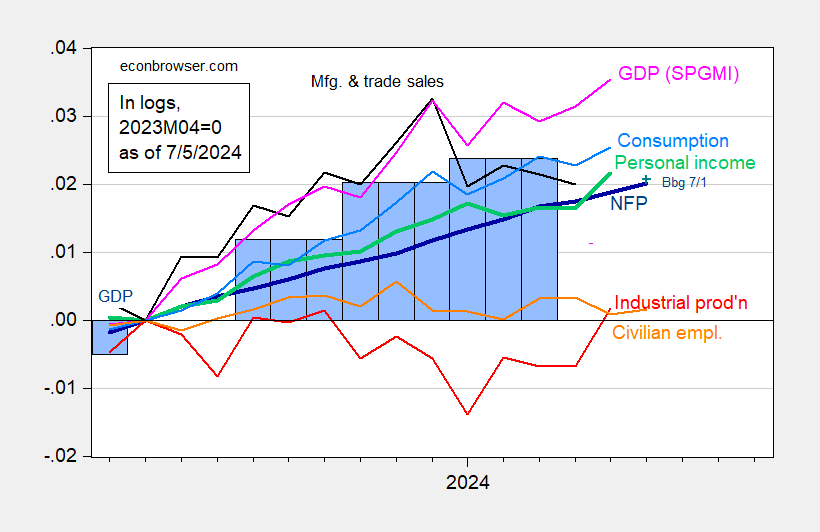
Figure 1: CES Nonfarm Employment (NFP) (bold blue), civilian employment (orange), industrial production (red), personal income excluding current transfers in Ch.2017$ (bold green), manufacturing and trade sales in Ch.2017$ (black), consumption in Ch.2017$ (light blue) and monthly GDP in Ch.2017$ (pink), GDP (blue bars), all log-normalized to 2023M04=0. Source: BLS via FRED, Federal Reserve, BEA 2024Q1 Third Release, S&P Global Markets Insights (formerly Macroeconomic Advisors, IHS Markit) (7/1/(version 2024) and author’s calculations.
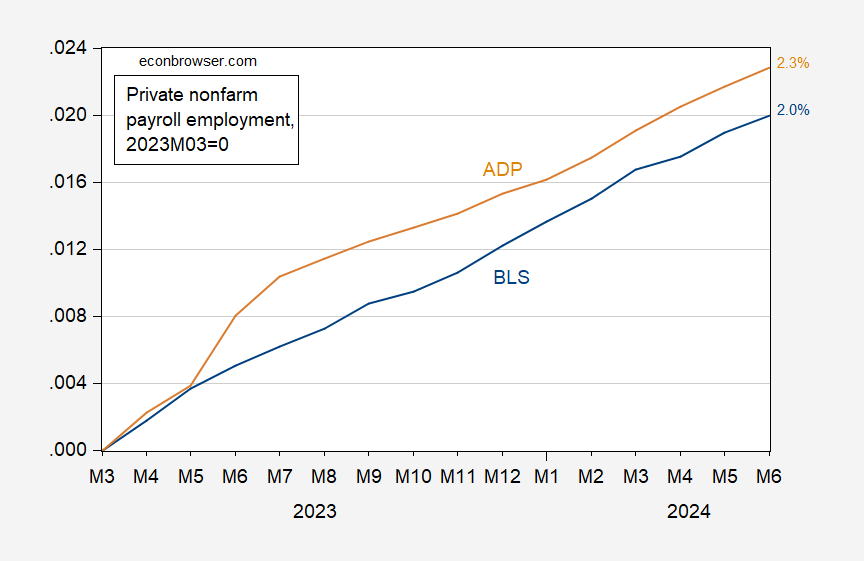
One might wonder if the CES is overstating employment growth, perhaps because of the birth-death model. Here is the cumulative growth of the private sector NFP since March 2023 (the latest benchmark), compared to the ADP series (which does not rely on the birth-death model).
Figure 2: Nonfarm private payroll employment from BLS (blue) and ADP (beige), in logarithms 2023M03=0. Source: BLS, ADP via FRED and author’s calculations.
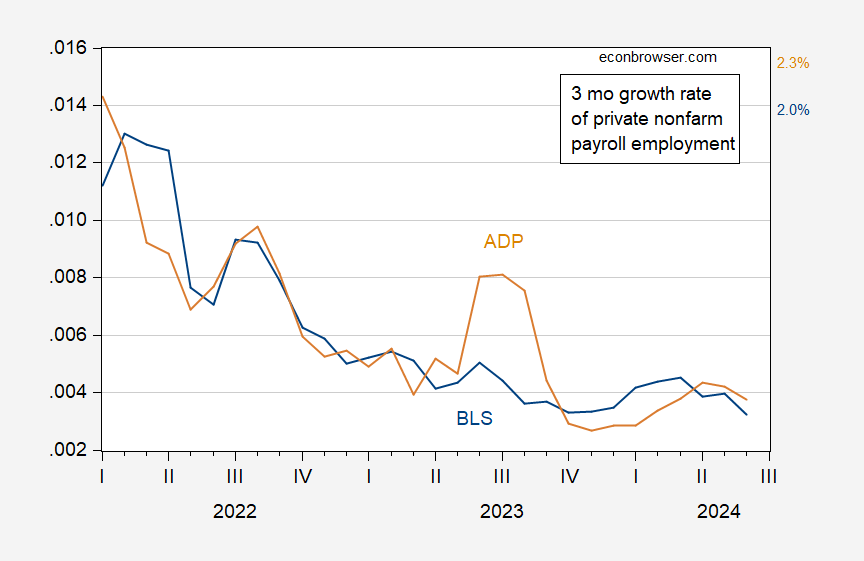
Here is the three-month growth rate (not annualized) of these two series.
Figure 3: Three-month growth rates of private nonfarm payroll employment from BLS (blue) and ADP (beige), calculated as log differences. Source: BLS, ADP via FRED, and author’s calculations.


