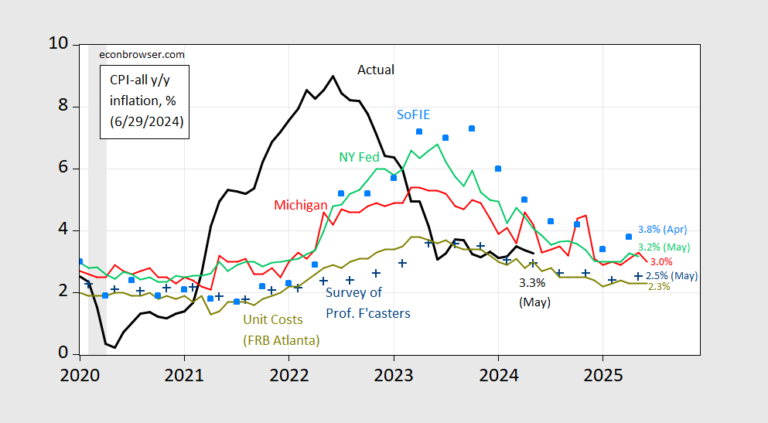
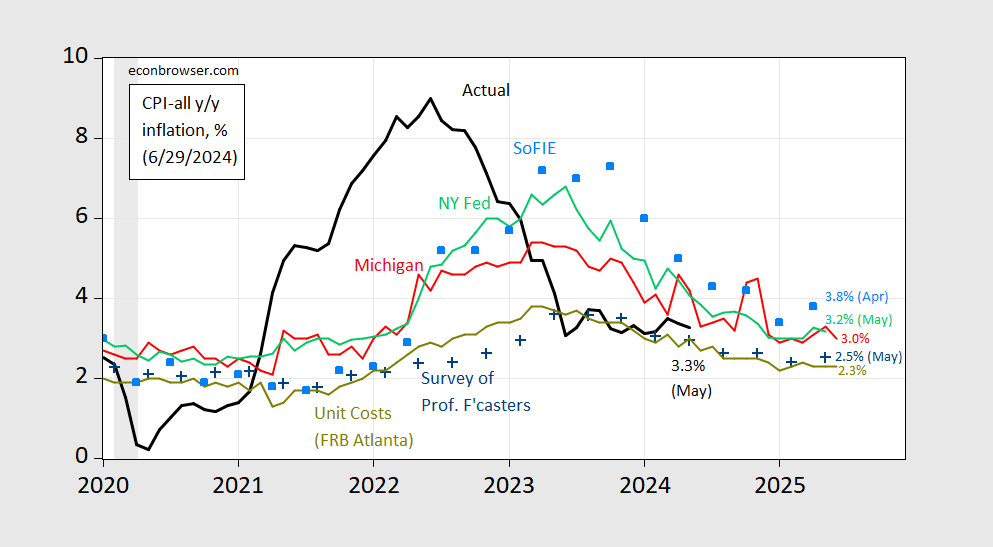
With the final June Michigan survey out, we have this image:
Figure 1: Actual year-over-year CPI inflation (bold black) and expected inflation from the University of Michigan (red), New York Fed (light green), Survey of Professional Forecasters (blue +), Coibion-Gorodnichenko SoFIE average (sky blue squares), and unit cost growth rate (chartreuse), all in %. Source: BLS, U.Michigan via FRED, Philadelphia Federal Reserve, Atlanta Federation, Cleveland Fedand the author’s calculations.
With CPI inflation about 0.45 ppt faster than PCE inflation over the 1986-2024 period, we are close to the PCE inflation target of 2%, at least as far as the SPF is concerned, perhaps half a ppt from the Michigan survey (which has historically been biased upward in terms of forecast errors). It is worth noting that unit cost expectations (Atlanta Fed) do not suggest imminent cost pressures.


